Quick overview
MAJIQ is a software package for defining and quantifying local splicing
variations (LSVs) from RNA-seq.
Install MAJIQ using the source code and pip.
Access the main user-facing pipelines using the command majiq:
$ majiq
usage: majiq [-h] [--version]
             {build,psi-coverage,moccasin,psi,deltapsi,heterogen,cite} ...

Tools to detect, quantify, and analyze RNA splicing

positional arguments:
  {build,psi-coverage,moccasin,psi,deltapsi,heterogen,cite}
    build               majiq-build pipeline to build splicegraph from
                        annotations and RNA-seq experiments
    psi-coverage        Prepare raw and bootstrapped coverage at LSVs for
                        quantification
    moccasin            majiq-moccasin pipeline for PsiCoverage batch
                        correction with known/unknown factors
    psi                 Quantify PSI from PsiCoverage files
    deltapsi            Quantify dPSI from two groups of replicate experiments
    heterogen           Test differences in PSI for two groups of independent
                        experiments
    cite                Information about how to cite MAJIQ

options:
  -h, --help            show this help message and exit
  --version             show program's version number and exit

More with majiq-* commands or majiq-v3
MAJIQ expects GFF3 files and SAM/BAM files as input. The GFF3 file is used to build an initial model of all annotated splicing changes in each gene. The SAM/BAM files are used to extract coverage over spliced junctions and retained introns in different RNA-seq experiments. MAJIQ uses this coverage to identify novel/unannotated junctions and retained introns, updating the model of all splicing changes. MAJIQ uses the updated model and per-experiment coverage to quantify splicing.
MAJIQ models splicing changes in each gene in terms of a splicegraph. MAJIQ quantifies splicing in terms of PSI on subsets of splicegraphs called LSVs.
So:
MAJIQ Builder creates a
SpliceGraphfile with the model of all genes andSJExperimentfiles with coverage for each experiment (majiq build).Then, the MAJIQ PsiCoverage command uses these two to create
PsiCoveragefiles with summarized raw and bootstrap coverage over LSVs (majiq psi-coverage).If used, MOCCASIN creates batch-corrected versions of these files (
majiq moccasin).Finally, MAJIQ subsequently uses these files for downstream quantification and analysis (MAJIQ quantifiers, MAJIQ Mendelian [working name]).
What is a splicegraph?
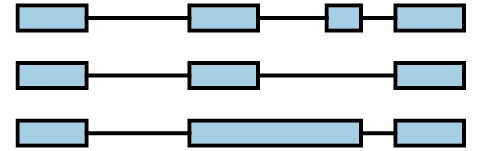
Genes are frequently modeled as a collection of transcripts. These transcripts are modeled as exons connected by junctions between adjacent exons. For example, a gene with 4 transcripts could be represented on the genome browser like:
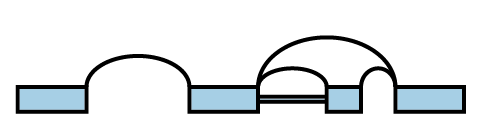
A splicegraph is an alternative model, where there is a single set of exons connected by junctions and retained introns. These junctions and retained introns are connections represent how exons can be spliced together. For example, the 4 transcripts above can be represented instead by the splicegraph:
What is an LSV?
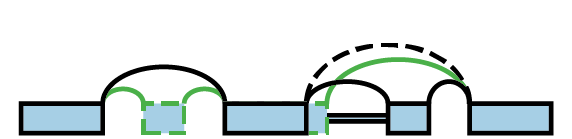
LSV stands for local splicing variation. LSVs model splicing decisions that start or end at the same exon. A single-source LSV is an exon and all connections that originate from that exon. A single-target LSV is an exon and all connections that end at that exon. For a more formal definition, please see [Vaquero2016].
An example splicegraph and associated LSVs:

How are LSVs quantified?
LSVs are quantified in terms of percent spliced in (PSI). PSI is the relative inclusion level of each connection in the LSV. In general, PSI takes values between 0 and 1, and the sum of PSI over the connections of a single LSV will add up to 1.
Differences in quantifications between (groups of) experiments are modeled as differences in PSI (dPSI). dPSI takes values between -1 and 1, and the sum of dPSI for the connections of a single LSV will add up to 0.
PSI and dPSI are not directly observed, so MAJIQ uses different statistical models to infer their values under different assumptions ([Vaquero2016], [VaqueroAicherJewellGazzara2021]).
What about VOILA?
VOILA is a companion software package for visualization of MAJIQ splicing analyses. It currently only supports MAJIQ v2, the previous version. This page will be updated once we are finished updating it for the new version.