Examples
Six module example
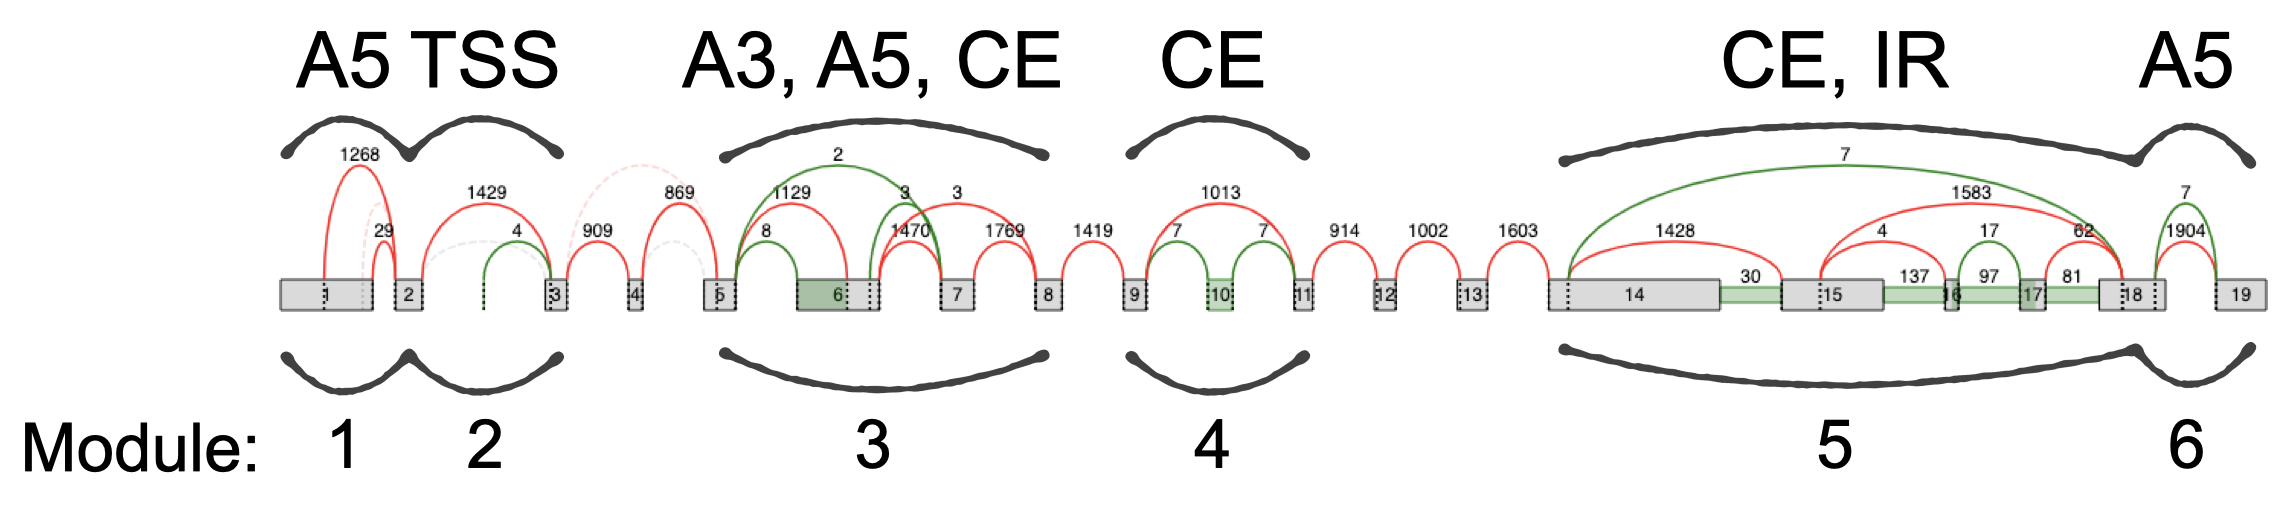 The TSS is its own module since it doesn’t overlap with other
modules. A5, alternative 5’ splice site; A3, alternative 3’ splice site;
CE, cassette exon; IR, intron retention; TSS, transcript start site.
The TSS is its own module since it doesn’t overlap with other
modules. A5, alternative 5’ splice site; A3, alternative 3’ splice site;
CE, cassette exon; IR, intron retention; TSS, transcript start site.
Output Files
All output files (including summary.tsv) have the following columns:
Module ID
- Unique identifier for the module, where <N> is the nth module
found along the gene, scanning from 5’ to 3’.
LSV ID(s): One or two LSV ID(s) separated by semi-colon
Gene Name
Gene ID
Chr
Strand
Each event file also has exon and junction name and coordinate columns:
Reference Exon Coordinate (if LSVs may be associated with the event)
Exon or Junction Name
Exon or Junction Coordinate
Plus the following columns if E(PSI) voila files provided:
<VoilaFileName>_E(PSI)
Expected value of the PSI distribution for each junction
<VoilaFileName>_Var(E(PSI))
Variance of the PSI distribution for each junction
- Note: take the square root to obtain the standard deviation of the
PSI distribution
<+Two more columns for each input Voila PSI file>
Or, the following if E(dPSI) voila files provided:
<VoilaFileName>_E(dPSI)
Expected value of the dPSI distribution for each junction
<VoilaFileName>_P(|dPSI|>=0.20)
Probability |dPSI|>=0.2 for each junction
- Note, ‘0.20’ is the default, but this threshold is specified by
–threshold
<VoilaFileName>_P(|dPSI|<=0.05)
Probability |dPSI|<=0.05 for each junction
- Note, ‘0.05’ is the default, but this threshold is specified by
–non-changing-threshold
<VoilaFileName>_<Group1>_E(PSI)
Expected value of the PSI distribution for each junction
- Note: if one of the input files is <Group1>.voila.psi, the
quantifications from the voila.psi file will be displayed, but *not* the quantification from the voila.deltapsi file. This is done to avoid having duplicate columns.
<VoilaFileName>_<Group2>_E(PSI)
Expected value of the PSI distribution for each junction
- Note: if one of the input files is <Group1>.voila.psi, the
quantifications from the voila.psi file will be displayed, but *not* the quantification from the voila.deltapsi file. This is done to avoid having duplicate columns.
<+Five more columns for each input Voila dPSI file>