Voila
View
Usage
Here is the command line usage statment output from voila view --help.
usage: voila view [-h] [-p PORT] [--host HOST] [--force-index] [--index-file INDEX_FILE] [--skip-type-indexing] [--strict-indexing] [--enable-passcode] [-j NPROC] [--debug] [-l LOGGER] [--silent] [--web-server {waitress,gunicorn,flask}]
                  [--num-web-workers NUM_WEB_WORKERS]
                  files [files ...]

positional arguments:
  files                 List of files or directories which contains the splice graph and voila files.

optional arguments:
  -h, --help            show this help message and exit
  -p PORT, --port PORT  Set service port. Default is a random.
  --host HOST           Set bind address. ex 0.0.0.0 for all interfaces. Default is a 127.0.0.1 (localhost).
  --force-index         Create index even if already exists.
  --index-file INDEX_FILE
                        Location of index file. If specified, will use a separate HDF5 based file for storing index data, rather than using input Voila file
  --skip-type-indexing  Skips creating index for lsv type data (alt3, alt5, binary, etc). These filters will no longer function, but there will be a significant indexing speedup
  --strict-indexing     When building an index for a study that uses multiple input voila files (such as heterogen), verifies that values for each LSV are the same across all input files. This protects against accidentally mixing or using inputs from different
                        runs, but slows down the indexing process.
  --enable-passcode     Disallow access to the viewer unless the special link is used to start the session (provides some security against port scanners accessing your app
  -j NPROC, --nproc NPROC
                        Number of processes used to produce output. Default is half of system processes.
  --debug
  -l LOGGER, --logger LOGGER
                        Set log file and location. There will be no log file if not set.
  --silent              Do not write logs to standard out.
  --web-server {waitress,gunicorn,flask}
                        Web server backend to use. Default is waitress
  --num-web-workers NUM_WEB_WORKERS
                        Number of processes used to handle web I/O (gunicorn workers). Only used if the web server is gunicorn. Default is half of system processor count.
Example
Here is a sample usage of the voila view command. The files positional argument just need the directories or files location for the splice graph and voila files. Voila will detect if the voila file is for psi or delta psi.
Once the server is running, you can have your browser to go the "Serving on" address to view the visualization.
Splice Graphs
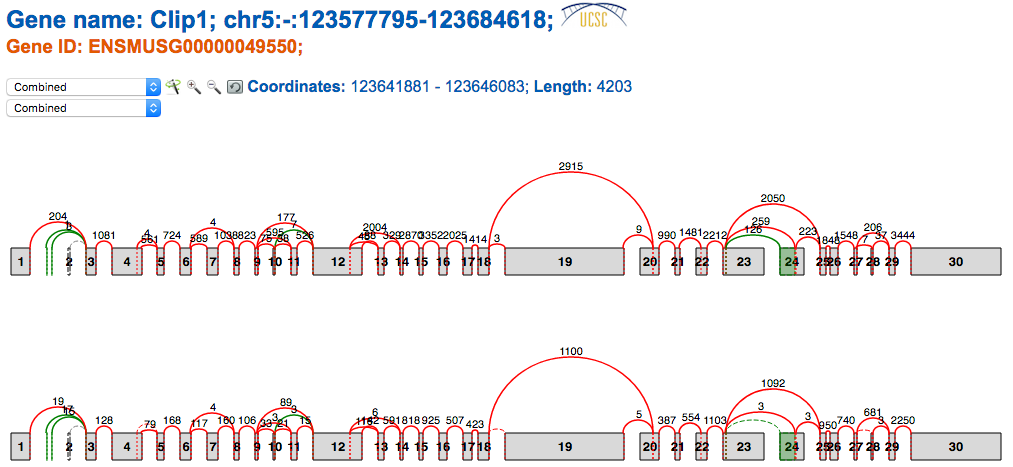
The splice graph gadget included in VOILA summarizes all the splice variants found in a gene by MAJIQ. Splice Graphs include the following features:
- Easy differentiation between exons and junctions annotated (red) and de novo detected (green) in RNA-Seq data,
- Contextual information about the coordinates for each exon and intron (hovering over exons/junctions).
- Raw reads counts for each junction. (Note MAJIQ applies several normalization factors to these raw values)
- Scaled view of the gene and the splice graph
 . By default,
introns
are trimmed to obtain a more compact representation of the splice graph. Switching between scaled
and
default view is accomplished by clicking on the wand.
- Zoom in/out to explore complex splice graphs.
- Possibility to switch between replicates (condition members) when more than one splice graph is available via the dropdown box.
All Gene Summaries include a descriptive legend of what you might find in the Splice Graphs:

DB refers to exons and junctions annotated in the GFF3 file and RNASeq to exons and junctions found in RNA-Seq data. RNASeq reads alludes to the raw reads found in RNA-Seq data. Please, note that retained introns (narrow rectangles connecting two exons) do not appear currently in the legend.
Note that when MAJIQ creates the splice graphs that VOILA visualizes, it considers the bounds of each individual exon in all transcripts containing that exon and the longest version is represented in the splice graph. So in the above example, the annotation database had longer versions of exons 17 and 19 corresponding to alternative transcription start sites for this gene and thus the starting positions are extended to reflect this.
PSI Summary
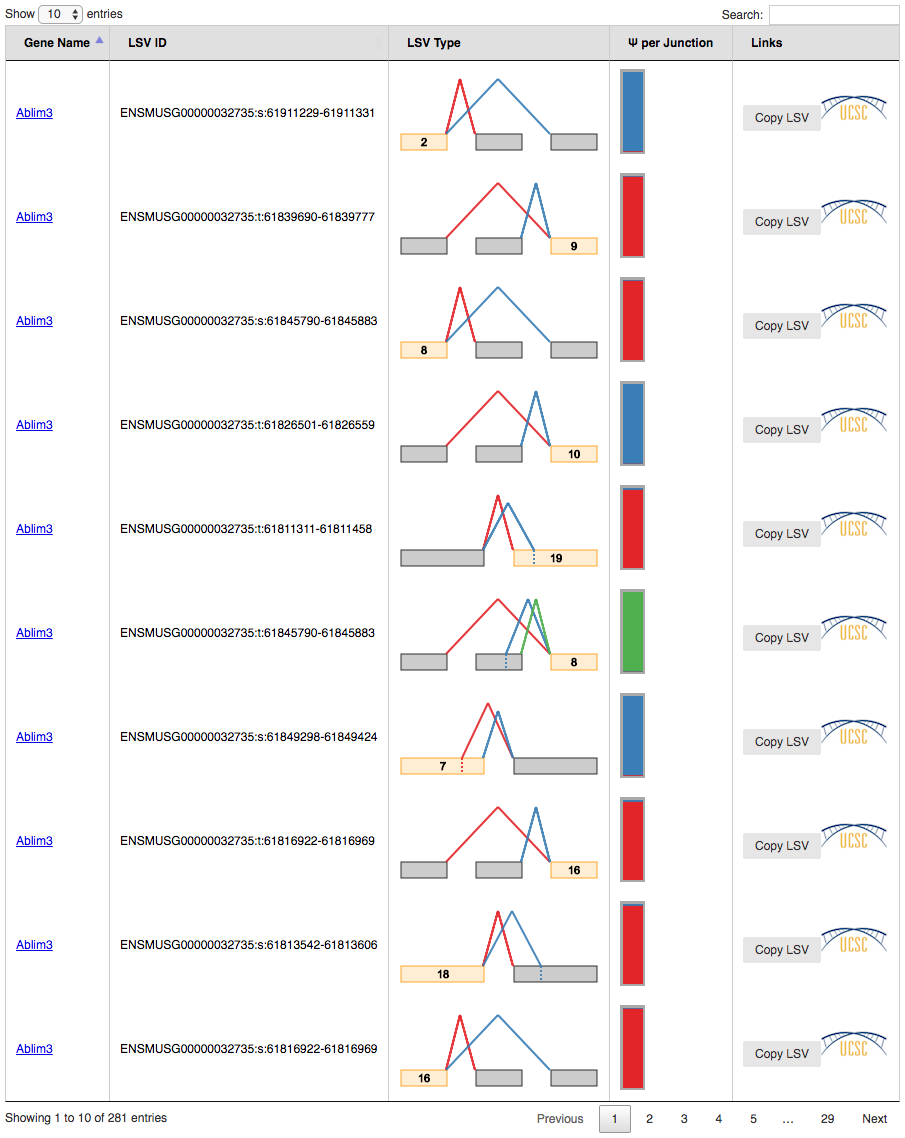
VOILA PSI Index file offers an overview of all the LSVs detected in a table, providing links to detailed summaries of LSVs and genes. Clicking over a gene or LSV ID opens up a new tab with a summary containing interactive splice graphs, distributions of PSIs per junction and links to the UCSC. Below is an example of PSI summaries for Tpd52l1:
Tip: PSI Summaries can be navigated through the Previous and Next links, without having to go back to the index file.
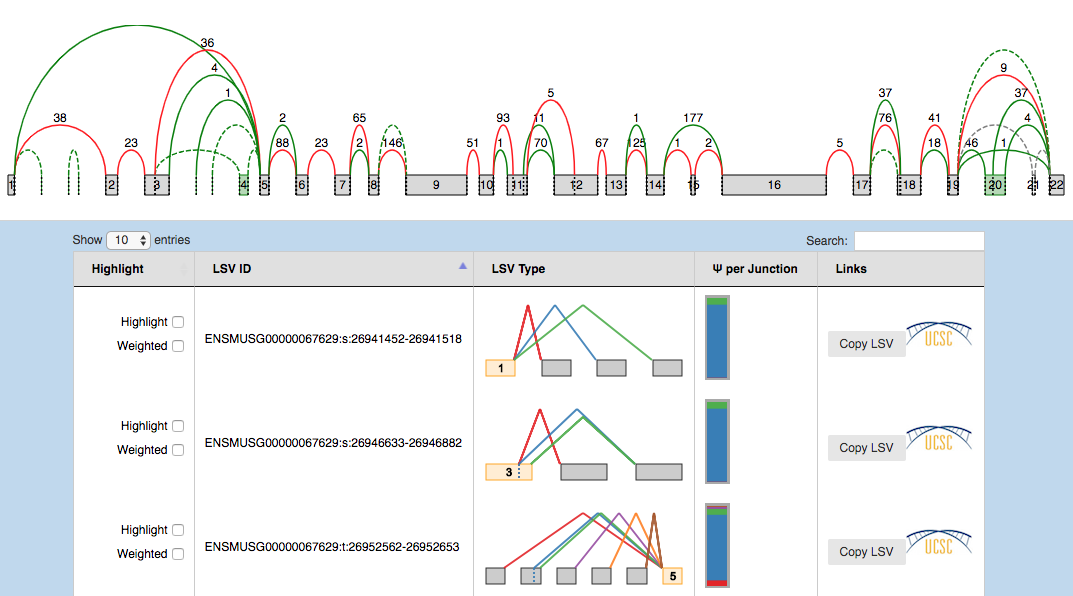
The information is broken into genes (10 per page), each of them with an interactive splice graph and an associated table with LSV quantification data. The table has the following information about the LSV:
- Hightlight:
- Hightlight. To move the visualization of the LSV to the splice graph, select the “highlight” checkbox in the LSV table. All junctions will be hidden except the ones included in the LSV. The visible junctions will be colored to match the highlighted LSV.
- Weighted. To weight the junctions of the highlighted LSV, check the “weighted” checkbox. The junctions for this LSV will now be weighted proportionally to the LSV’s expected PSI value for this experiment.
- LSV ID: a unique identifier for the LSV.
- LSV type: a thumbnail representing the splicing event. Each junction has a different color.
- PSI per junction: the expected Percent Selected Index (PSI) per junction. It has two views
that can
be switched between by clicking on them:
- Compact view. Initially, the PSI per junction is represented by the height of a colored box. Each color refers to the expected inclusion of a particular junction. The taller the rectangle, the more included the junction is expected to be. Clicking on the rectangle (zoom in pointer) will open the expanded view.
- Expanded view. Distributions of probabilities of PSI per LSV junction (violin boxplots). The white dot represents the expected PSI, whereas the box plot indicates the 10, 25, 50, 75 and 90 percentile of the distribution. Consistently with the Compact view, each color refers to a particular junctions of the LSV.
- LSV links:
- UCSC. Coordinates link to explore the LSV on UCSC Genome Browser (when available).
- Copy LSV. The new VOILA supports copy-paste functionality into a new web-tool, MAJIQ-SPEL. SPEL allows users to connect the LSV quantification to the various gene isoforms associated with those, automatically design RT-PCR primers for validating the LSV (with optional control over primer design parameters), and map the LSV to protein domains on the genome browser for functional integration and downstream analysis. See more details: http://biorxiv.org/content/early/2017/05/09/136077
Lastly, the panel LSV filters allows the user to screen out LSVs with certain properties like having alternative 5-prime splice sites, involve Exon Skipping or contain a certain amount of exons and junctions.
Delta PSI Summary
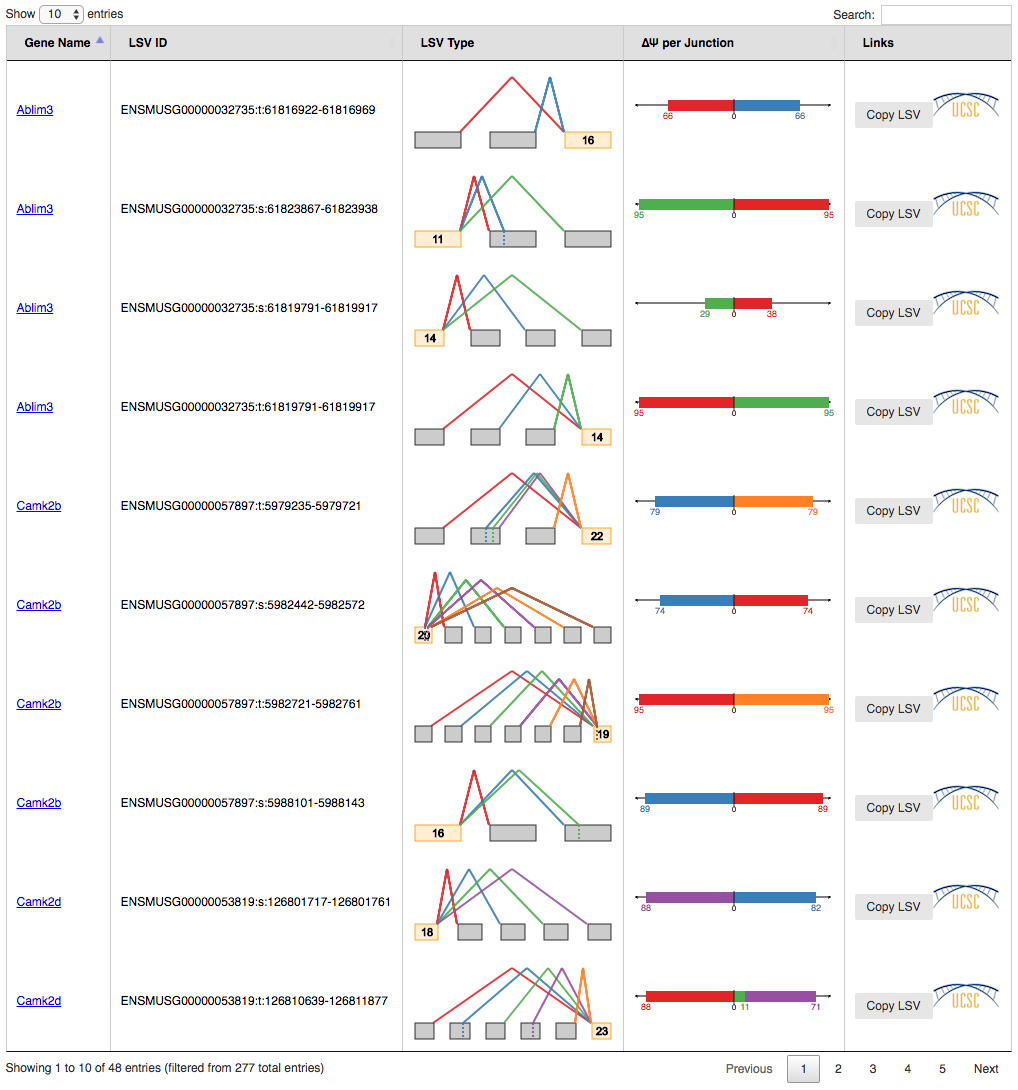
Tip1: index tables can be sorted by gene name, LSV Type and/or most changing junction clicking on the column header respectively. It is possible to sort the table by multiple columns holding the shift key. Tip2: You can display all LSVs that changed above the specified dPSI threshold (default 0.2) by clicking the dropdown box at the bottom left and select "All" (default: display 10 LSVs). This allows for quick searching (Ctrl+F) for genes of interest.
Delta PSI index file is identical to PSI index except for the PSI per junction column that represents the estimated differential inclusion levels as bars leaning towards condition1 or condition2 (see Compact view below). Clicking over LSV IDs and genes opens up individual summaries.
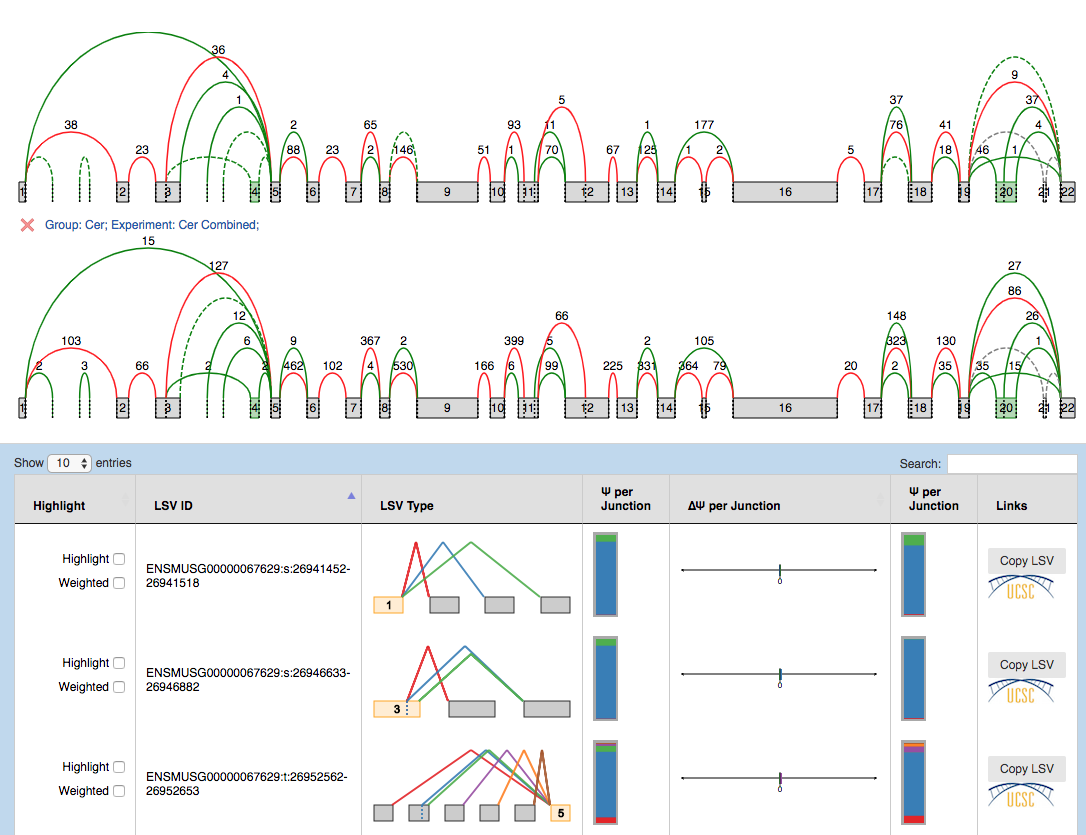
The results are broken into 10-genes per page summaries, with LSV quantifications grouped by gene. Unlike in single PSI summaries, there are 2 splice graphs (one per condition) which facilitate quick visual inspection of possible differences. If multiple replicates were used in a condition, the splice graphs for each replicate can be switched between through the drop down box located next to the wand. The LSV information is displayed as follows:
- Hightlight:
- Hightlight. To move the visualization of the LSV to the splice graph, select the “highlight” checkbox in the LSV table. All junctions will be hidden except the ones included in the LSV. The visible junctions will be colored to match the highlighted LSV.
- Weighted. To weight the junctions of the highlighted LSV, check the “weighted” checkbox. The junctions for this LSV will now be weighted proportionally to the LSV’s expected PSI value for this experiment.
- LSV ID: a unique identifier for the LSV.
- LSV type: a thumbnail representing the splicing event. Each junction has a different color.
- PSI condition[1|2]: individual Ψ in condition[1|2], similar to the Ψ per junction column in PSI summary, with compact and expanded views.
- More in condition 1 | More in condition 2: the expected delta PSI for all
junctions. It
has two views which can be switched between by clicking on them:
- Compact view. Initially, the observed delta PSI preference for a certain condition (more included) per junction. A bar going towards condition 1 (left) with a value of 26 means that the junction is 26% more included in condition 1 than in condition 2. Each color refers to a particular junction of the LSV. In the above example, the red junction is 26% more included in cerebellum compared to adrenal gland.
- Expanded view. Distributions of probabilities of Delta PSI per LSV junction (violin boxplots). The white dot represents the expected PSI, whereas the box plot indicates the 10, 25, 50, 75 and 90 percentile of the distribution. Consistent with the Compact view, each color refers to a particular junction of the LSV.
- LSV links:
- UCSC. Coordinates link to explore the LSV on UCSC Genome Browser (when available).
- Copy LSV. The new VOILA supports copy-paste functionality into a new web-tool, MAJIQ-SPEL. SPEL allows users to connect the LSV quantification to the various gene isoforms associated with those, automatically design RT-PCR primers for validating the LSV (with optional control over primer design parameters), and map the LSV to protein domains on the genome browser for functional integration and downstream analysis. See more details: http://biorxiv.org/content/early/2017/05/09/136077
Summary Drop Down Menus
- Index. Returns you to the index page.
- Splice Graph. There are two parts to this menu. The left side has a form to add specific Splice Graphs to the view. The right side has a juction reads filter. Select the checkbox to activate this form and then fill in the fields to hide unwanted junctions.
- LSV. This provids a form to filter out LSVs from the LSV summary table.