What is an LSV?
LSV stands for "local splicing variation". Briefly, exons that are spliced together can be represented
using
a splice graph Heber
et al. 2002 such as this:

In Voila Splice graphs, exons are represented by rectangles and junctions (or edges) by arcs. The raw number of reads spanning a junction is also displayed. For a more detailed description see splice graphs description.
LSVs involve an exon (or node in the splice graph) from which splits in the graph originate (single source LSV, or SS-LSV) or an exon into which several graph edges converge (single target LSV, or ST-LSV). An illustration of a splice graph is shown below with several SS-LSV and ST-LSV marked. The "local" aspect of LSVs definition stems from the fact they involve only a single source or single target exon. For a more formal definition please see Vaquero-Garcia et al., 2016.
 The terminology of LSVs generalizes that of alternative splicing (AS) "events" and AS events "types".
The
most common AS types in mammals are skipped exons, alternative 3' splice site, and alternative 5' splice
site (Wang et al., Nature
2008). These types can all be seen as specific cases of simple or binary LSVs, i.e. LSVs that
involve only two way graph splits (see figure above). However, we find that the transcriptome contains
many
other types of LSVs that involve different combinations of 3' and 5' splice site choices in different
exons
(see figures above/below, or just run your data through MAJIQ/VOILA...). Consequently, the LSV
terminology
helps us define and quantitate more accurately the spectrum of local splice variations observed in the
transcriptome, many of which are complex.
Conceptually, LSVs are aimed to fill the gap between previously defined AS "types" described above, and full transcripts/isoforms. Ideally, we would like to identify and quantify all existing isoforms of each gene in a given RNA-Seq experiment. However, the complexity of gene isoforms combined with the shortness of current sequencing reads (typically ~100 nt long) makes isoform quantification from RNA-Seq reads a challenging problem. In contrast, LSVs can arguably still capture a lot of useful information about transcriptome variability while being deduced directly from RNA-Seq reads that span across splice junctions.
What is LSV quantification?
MAJIQ's LSV quantification is based on estimating the relative inclusion level of each junction in the LSV. For simple, binary, cases such as skipped exons, LSV quantification is equivalent to estimating the exon's percent spliced in (PSI, or Ψ). For more complex LSVs that involve three or more splice graph edges (i.e., exon joining options), MAJIQ computes the marginal inclusion level, or PSI, per junction. Computing only these marginals allows MAJIQ to handle complex LSVs, keeping computational cost linear with the number of edges while still delivering estimates for the interesting biological question of "how much is each junction used?".
When estimating PSI for a LSV's junctions, MAJIQ produces a complete posterior distribution over possible PSI values. This distribution takes into account the number of reads observed at each junction, their distribution across genomic positions, GC content bias, and some possible mapper or technical artifacts. Intuitively, the deeper and smoother the coverage of an LSV, the more concentrated the PSI posterior would be (i.e. the more "sure" MAJIQ is about the "true" PSI value), while lower and less even coverage would result in higher variance of the PSI estimate.
Similarly, MAJIQ's quantification of LSV's differential inclusion when comparing two conditions is based on estimating a posterior distribution for the change in each junction's relative inclusion level, termed delta PSI (ΔΨ). Naturally, this distribution lies in the range of -100% to +100% (or -1 to +1 when using fractions instead of percentages). *Note: For a thorough description of MAJIQ's quantification algorithm for Ψ and ΔΨ and the various parameters that control it see Vaquero-Garcia et al., 2016.
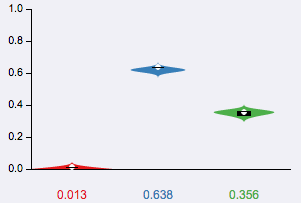
Voila's visualization of LSV Quantification uses several different techniques. In all cases, colors are used to represent the different junctions in the LSV. Voila uses violin plots to represent the posterior probability distribution for Ψ or ΔΨ. Examples of the violin plots for single Ψ are shown below.
PSI
Compact view

When displaying lists of LSVs Voila uses a compact stacked bar chart representation. The height of each bar represent the expected PSI (E[Ψ]) which naturally add to 100% over all the LSV's junctions. Clicking over the bars will open a more detailed representation of the PSI distribution.
Violin plots (binary and multi-way LSV)

Violin plots are boxplots plotted over the original distributions. The box goes from the 25th to the 75th percentile, with a white horizontal line indicating the 50th percentile (median). The tails represents the 10th and 90th percentile. Additionally, the expected PSI or E[Ψ] is marked with a white circle.
Delta PSI
Compact view

For compact visualization of ΔΨ quantification, each colored bar represents the percentage of the expected differential inclusion for the matching edge in the splice graph. The arrows indicate the preference for one condition versus another. In this example, the blue junction is shown to have 40% more inclusion in YoungBeta compared with OldBeta. In contrast the green junction is expected to be more included in OldBeta by a 35% difference. Note that in this case the numbers do not generally sum to 1 or 100% as they reflect MAJIQ's expected change for each junction separately. In addition, users can use the more detailed violin plots to gain other information/statistics such as the confidence and probability distribution per junction.
Violin plots (binary and multi-way LSV)

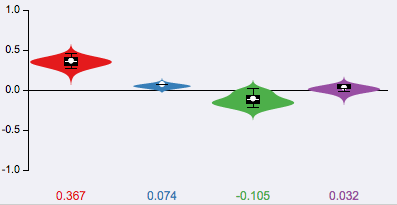
Each violin correspond to the posterior distribution of a junction in the LSV (not shown here) for delta PSI analysis of condition1 Vs condition2. For each junction, the expected delta PSI or E[ΔΨ] is shown at the bottom, where negative values correspond to increased differential inclusion in condition1 compared with condition2 whereas a positive E[ΔΨ] denotes preference for condition2 Vs condition1.
. In this example, the purple junction (the actual LSV is not shown here) is shown to have a 75% confidence, based on the observed reads, that its inclusion in condition 1 is increased by at least 20% compared with condition 2. In contrast the red and blue junctions have confidence of 28% and 38% respectively of dropping by at least 20% (i.e. increased exclusion) in condition 2. Note that in this case the numbers do not generally sum to 1 or 100% as they reflect MAJIQ's confidence for each junction separately that its inclusion was increased/decreased by more than the given threshold. In addition, users can use the more detailed violin plots to gain other information/statistics such as the expected ΔΨ per junction. -->
What is MAJIQ?
MAJIQ is a software package that allows researchers to define and quantify both known and novel Local Splice Variations (LSVs) in genes from RNA-Seq data.
MAJIQ's main features
MAJIQ takes as input a set of RNA-Seq experiments (sorted, indexed BAM files) and previous genome annotation (GFF3 files) and produces the following:
- Splice graph for each gene based on both known transcripts annotation and de-novo junctions detected.
- All detected (known + novel) single source and single targets LSVs per gene.
- Quantification of LSVs from a given RNA-Seq experiment (w/wo replicates).
New Majiq changes (v1.1.x) The new version of Majiq v1.1.x is a reimplementation of the software in order to achieve a faster and memory efficient execution. The structure has been refactored be able to work with huge datasets with a lower memory imprint. This new version uses python >= 3.5 implementation and cython modules. The output has been highly reduced with smaller and faster output files and removing the creation of temporary files. All this has been implementing keeping all the Majiq functionalities like complexity quantification, denovo junctions/exon detection and visualization, that made MAJIQ stands out from other RNASeq differential splicing tools. We added the possibility to store back in disc the annotation DB complementing it with the denovo elements found in the data, this enriched DB can be feed as input to MAJIQ on future runs.
What MAJIQ is not
There are many RNA-Seq analysis tasks for which MAJIQ was not designed or is currently not structured to address. Some examples include:
- Gene/isoform expression estimation: MAJIQ uses expression levels when it quantifies LSVs. For example, LSVs that are not present in the data will not be quantified and those with lower coverage will result in lower confidence for the relative inclusion of matching RNA segments. However, MAJIQ only computes relative inclusion of junctions in an LSV (e.g., 80% inclusion of an alternatively skipped exon). Consequently, computing the expression of genes or isoforms and comparing those in the same experiment or between experiments is not supported.
- Relative isoform abundance: MAJIQ only operates at the level of local splice variations (LSVs). It does not assume the full spectrum of gene isoforms is known and does not quantify those.
- Novel gene/non coding RNA detection: MAJIQ requires a transcriptome annotation file (GFF3). It supplements by identifying both known and novel splice junctions within the bounds of existing loci in the provided annotation. Putative isoforms of new loci are not inferred during this process.
- Alternative transcription start/end
- Alternative polyadenylation (APA) identification/quantification.
What is Voila?
Voila is a package to interactively visualize splice variations in RNA-Seq data. It is written in Python and produces summary files in HTML5 that can be opened and interactively explored with any modern browser*. It has been conceived as the visual component of MAJIQ for analysis of Local Splice Variants (LSVs).
*Voila has been tested on Google Chrome [recommended], Firefox, and Safari.
How to cite us?
Primary Publication If you use MAJIQ in your published work, please cite this publication: Vaquero-Garcia J, Barrera A, Gazzara MR, et al. A new view of transcriptome complexity and regulation through the lens of local splicing variations. eLife, 5, e11752. http://doi.org/10.7554/eLife.11